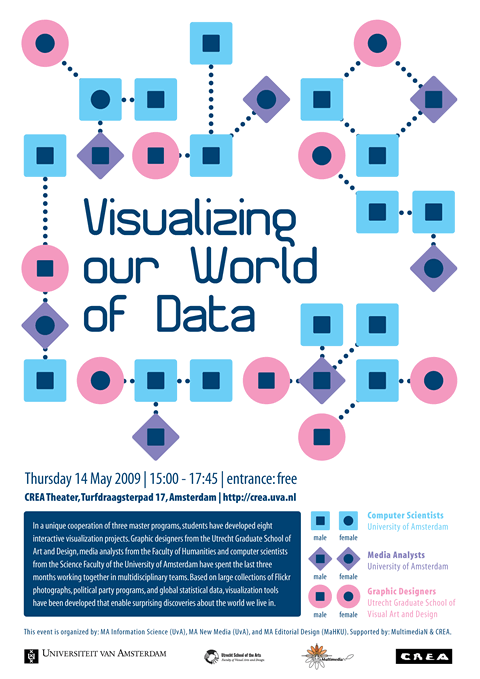
When: Thursday 14 May 2009, 15:00-17:45 o'clock
Where: CREA Theater, Turfdraagsterpad 17, Amsterdam, http://crea.uva.nl
Entrance: free
In a unique cooperation of three master programs, students have developed eight interactive visualization projects. Graphic designers from the Utrecht Graduate School of Art and Design, media analysts from the Faculty of Humanities and computer scientists from the Science Faculty of the University of Amsterdam have spent the last three months working together in multidisciplinary teams. Based on large collections of Flickr photographs, political party programs, and global statistical data, visualization tools have been developed that enable surprising discoveries about the world we live in.
This event is organized by: MA Information Science (UvA), MA New Media (UvA), and MA Editorial Design (MaHKU). Supported by: MultimediaN & CREA.


Leave a comment